Medicare Advantage payers process 50M+ prior auth and potentially deniable claims per year. Of the 50M+, only 7% tend to be denied and only 10% of the denied tend to be appealed (i.e., ~0.7% of all claims are appealed).
Finding #1: Appealed claims tend to be overturned or upheld at a 40-50% either direction.
Opportunity: Suggesting a real opportunity for payers to tighten their initial determination
Overall, less than 0.3% of the claims make it to an independent review process despite CMS mandating that claims appealed and not overturned get reviewed through the IRE. A key driver of this low volume in IRE can be attributed to the low rate of appeals (<10% of denied claims).
Furthermore, this independent review process tends to significantly favor the original determination by the payer– with historical rates of overturns hovering around 3-5%, with most recent data in 2023 suggesting a 3% rate. This suggests that the appeal process by payers is, on an aggregate, thorough.
That said, the IRE overturn volume is significant for payers to (1) optimize their Stars measures (in particular, C29 measure), and (2) understand where the most debate between payers and providers in the appeals process lays, pointing to two key signals:
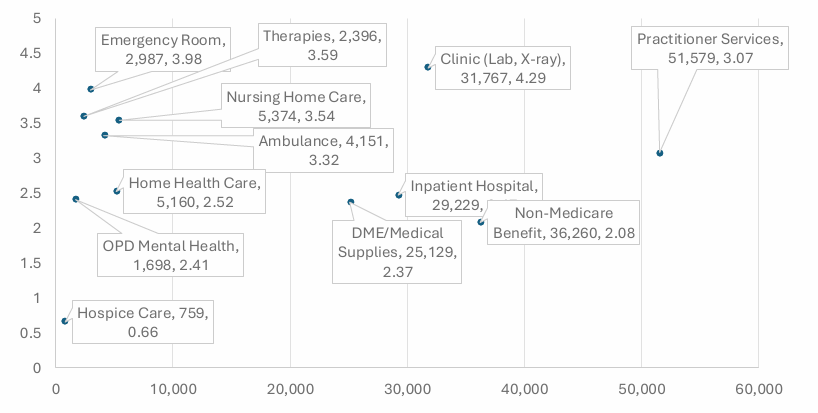
Finding #2: ER, Therapies, Nursing Care and Clinical / Lab services tend to be the most contended services.
Opportunity: Payers should adopt better Medicare-aligned policies and tighten their adjudication process in this area
Finding #3: Amongst payers, there is a significant variation within payer overturn rates (e.g., Highmark and Elevance are ~1% overturns, whereas other Blues, Centene and CVS are 4-5% overturns)